When it comes to web development or troubleshooting, the ability to inspect elements on a webpage is invaluable. Inspecting elements allows you to view and manipulate the HTML and CSS of a site in real time, making it easier to debug issues, optimize performance, or test changes.
If you’re working on a Mac, there are several methods to inspect elements using browsers like Chrome, Safari, and Firefox. In this guide, we’ll explore how to inspect elements on a Mac through different methods and browsers, offering step-by-step instructions for each.
What is Element Inspection?
Element inspection refers to examining and modifying a webpage’s underlying HTML (Hypertext Markup Language) and CSS (Cascading Style Sheets) using browser developer tools. These tools allow you to inspect the code behind any webpage and make temporary changes to see how modifications would affect the site visually.
Some of the key things you can do while inspecting elements include:
- View and modify HTML/CSS: You can see the full structure of the webpage’s code, modify the content or style, and view how changes affect the page in real time.
- Debugging: Spot and fix errors in your code, especially in HTML, CSS, or JavaScript, without affecting the live website.
- Performance Testing: You can examine which parts of the code affect the site’s load time or performance, helping you optimize the webpage.
This feature is especially useful for developers and designers who need to quickly test changes or troubleshoot layout and functionality issues.
Why is Inspecting Elements in Browsers Crucial?
There are several reasons why inspecting elements in browsers is important, particularly for web developers, designers, and QA specialists:
Troubleshooting Issues
Whether it’s a styling bug or a functionality error, inspecting elements allows you to directly pinpoint and fix problems. By tweaking HTML and CSS in real time, you can quickly identify why certain elements are not behaving as expected.
Understanding Website Structure
For budding developers or those learning the ropes of web development, inspecting elements is a great way to reverse-engineer websites. You can view and learn from the code of well-constructed websites, gaining insight into how they were designed.
Live Editing
You can make temporary changes to the structure and style of a webpage using the inspect element tool. This allows you to test different ideas without permanently altering the website, enabling you to experiment freely.
Cross-Browser Compatibility
Webpages can behave differently across browsers. By inspecting elements on various browsers, you can ensure your site works seamlessly for all users, irrespective of the browser or device they use.
Performance and SEO Optimization
By analyzing the code, developers can identify inefficient elements that may be slowing down a site. Additionally, inspecting metadata and schema allows for SEO optimization directly within the browser.
How Do You Inspect Elements in the Browser?
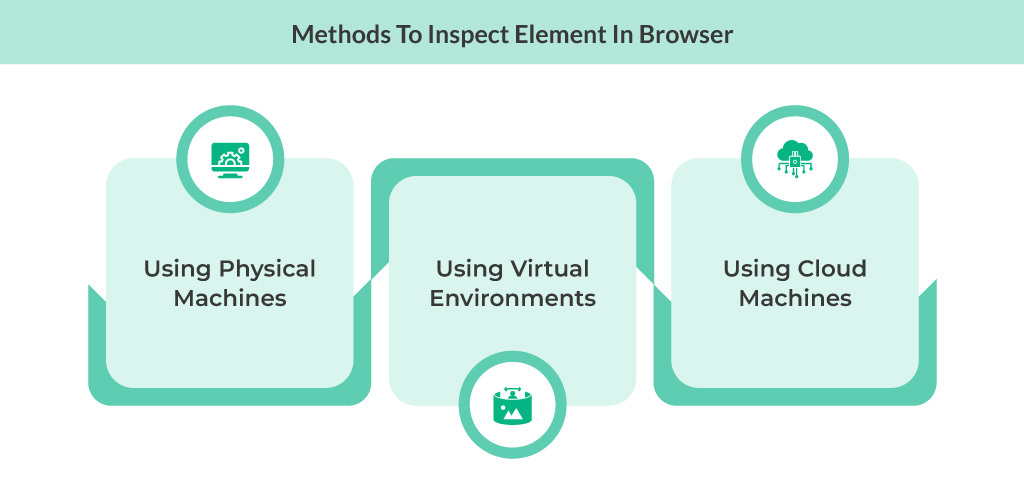 There are several methods to inspect elements on a Mac, depending on whether you’re using a physical machine, a virtual environment, or cloud-based solutions. Let’s explore each in detail.
Method 1: Inspect Elements on Mac Using Physical Machines
The most common approach to inspect elements on a Mac involves using the built-in developer tools in popular browsers. Here’s how to access and utilize the inspect element feature:
Steps to Access Developer Tools:
- Open Your Browser: Launch your preferred browser (Safari, Chrome, or Firefox).
- Access Developer Tools:
Safari:
- Go to Safari > Preferences.
- Click on the Advanced tab.
- Enable Show Develop menu in menu bar.
- Now, right-click on any web element and select Inspect Element.
Chrome:
- Right-click on the webpage and choose Inspect.
- Alternatively, you can use the keyboard shortcut Cmd + Option + I.
Firefox:
- Right-click on the desired element and select Inspect.
- You can also use the shortcut Cmd + Option + I.
Utilizing the Inspect Element Feature:
- Elements Panel: Displays the HTML structure of the page. You can hover over elements to see their styles and dimensions.
- Styles Panel: Shows CSS styles applied to the selected element, allowing you to modify them in real time.
- Console: Use this to run JavaScript commands and debug.
- Network Panel: Monitor network requests and resources loaded by the page.
Method 2: Inspect Elements on Mac Using Virtual Environments
Setting up virtual machines can help you test cross-browser compatibility and inspect elements in a controlled environment. Here’s how to do it:
Setting Up a Virtual Machine:
- Choose Your Software: Download and install virtualization software such as Parallels or VirtualBox.
- Install a Virtual OS:
- Follow the prompts to create a new virtual machine.
- Install the operating system of your choice (Windows, Linux, etc.).
- Access Different Browsers:
Once your virtual machine is running, install the browsers you want to test (Chrome, Firefox, Edge, etc.).
Open the browser and use the inspect element feature as described in Method 1.
Benefits of Using Virtual Environments:
- Cross-Browser Testing: Easily switch between different operating systems and browsers.
- Isolation: Keep your testing environment separate from your main operating system.
Method 3: Inspect Elements on Mac Using Cloud Machines
Cloud-based platforms provide a convenient way to inspect elements across various browsers and devices without the need for physical or virtual machines. Here’s how to get started:
Using Cloud-Based Platforms:
- Choose a Service: Sign up for a cloud testing service like BrowserStack or Sauce Labs.
- Select Your Browser and Device:
- Choose the browser and operating system combination you want to test.
- You can simulate different devices, including mobile and tablet screens.
- Access Developer Tools:
- Once the environment is set up, you can open developer tools within the cloud platform.
- Inspect elements just like you would on a physical machine.
Advantages of Cloud Testing:
- Access to Latest Browsers: Always have the latest versions of browsers available for testing.
- No Setup Required: Avoid the hassle of installing and configuring multiple operating systems.
How To Inspect Elements on Mac – Chrome
Google Chrome is a widely used browser that provides a robust set of developer tools for inspecting and debugging web pages. Below is a guide on how to use Chrome’s Inspect Element feature.
Ways to Inspect Elements in Chrome:
- Open Chrome: Launch Google Chrome on your Mac.
- Right-click on an Element:
- Right-click on the element you want to inspect.
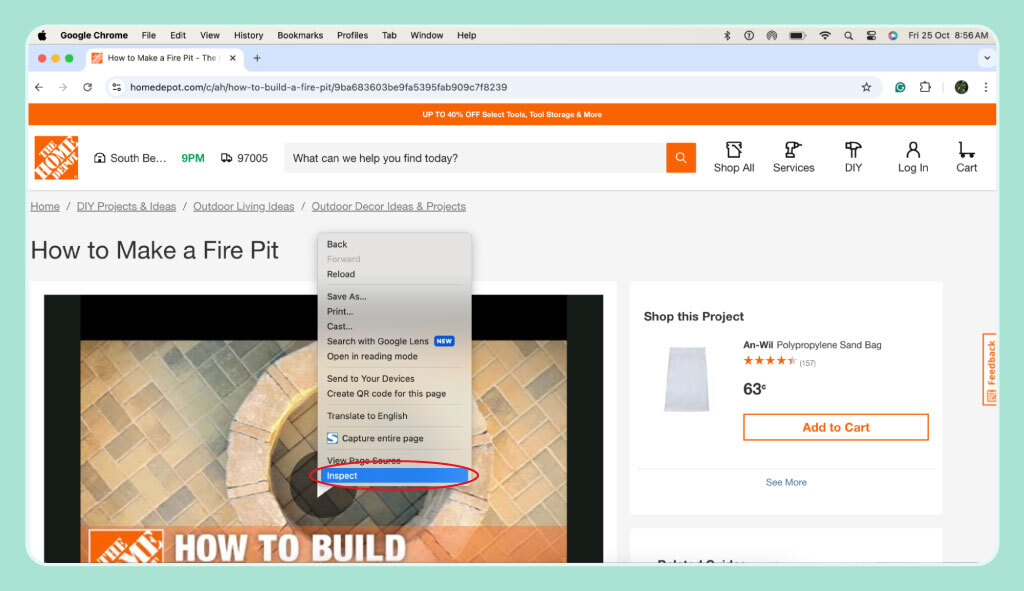
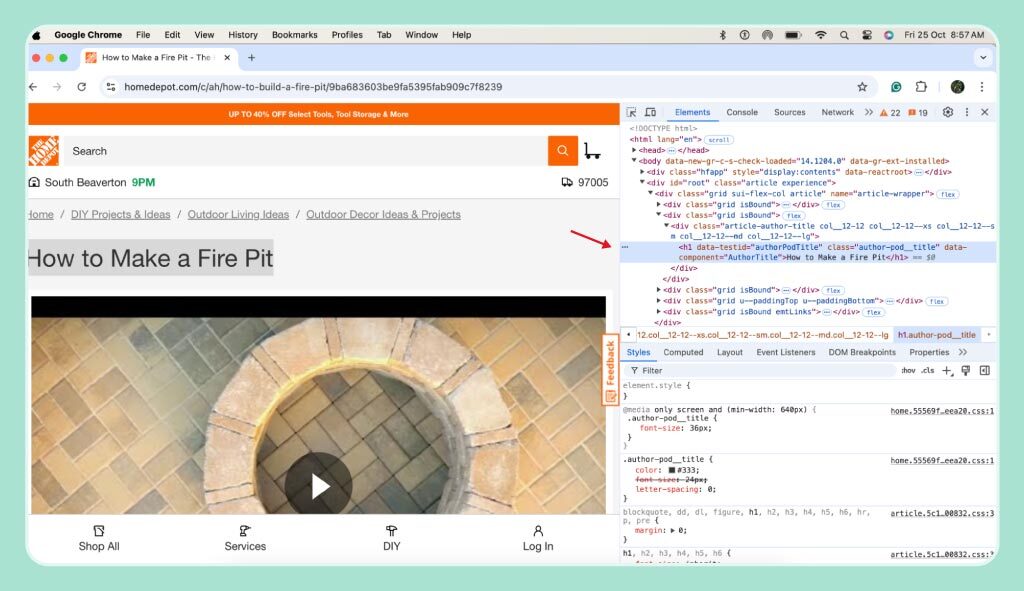
- From the context menu, select Inspect. This will open the Elements Panel with the selected element highlighted.
- Using Keyboard Shortcuts:
- You can also use the shortcut Cmd + Option + I to open Chrome Developer Tools.
- To directly highlight a specific element, hover over it, then press Cmd + Shift + C to enter element inspection mode.
 Additional Features in Chrome Developer Tools:
- Device Toolbar: Click the Toggle Device Toolbar icon in the top-left corner to simulate mobile devices and see how the page renders on different screen sizes.
- Elements Search: Use the search bar in the Elements Panel to find specific HTML tags or CSS styles.
How To Inspect Elements on Mac – Safari
Safari is the default browser for Mac users, and it comes with powerful built-in developer tools. However, you must first enable the developer menu to access the Inspect Element feature.
Enabling the Developer Menu in Safari:
- Open Safari: Launch Safari on your Mac.
- Enable the Develop Menu:
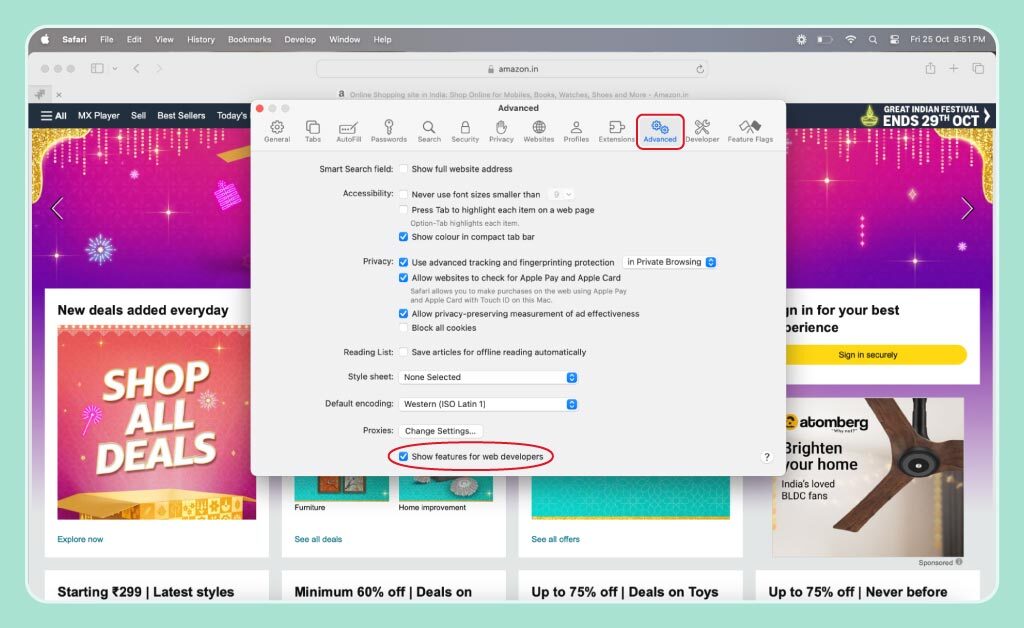
- Go to Safari > Settings in the top menu.
- Navigate to the Advanced tab.
- Check the box labeled Show features for web developers

- Right-click to Inspect:
- Once the Develop menu is enabled, right-click on any element on a webpage.
- Select Inspect Element from the context menu to open the Web Inspector.

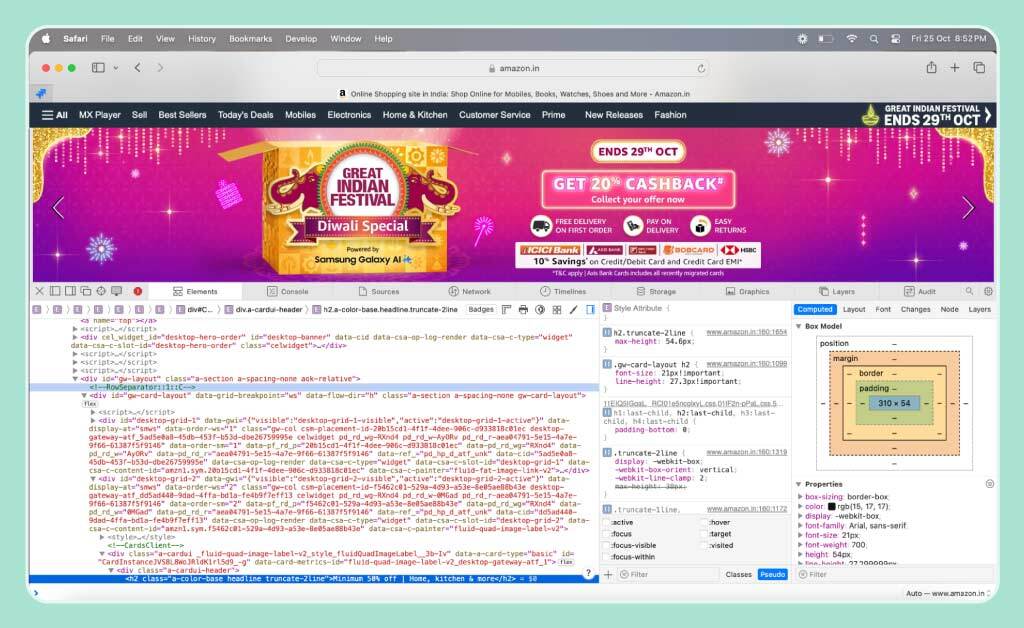
- Using Keyboard Shortcuts:
- Alternatively, press Cmd + Option + I to open the Web Inspector.
- To inspect a specific element, use Cmd + Shift + C to activate inspection mode.
Exploring Safari’s Web Inspector:
- Elements Panel: Displays the HTML and DOM structure. You can edit, delete, or rearrange elements directly.
- Styles Panel: Modify CSS properties in real-time to see how changes affect the design.
- Console: This is for logging information and debugging JavaScript.
- Network Tab: Monitor requests and optimize load times.
Safari-Specific Features:
- Responsive Design Mode: Under the Develop menu, select Enter Responsive Design Mode to preview how your webpage looks on various devices and screen sizes.
- JavaScript Debugger: Safari offers an advanced debugging tool for JavaScript, allowing you to set breakpoints and inspect function execution.
How To Inspect Elements on Mac – Firefox
Firefox also provides a rich set of developer tools that are tailored for inspecting and debugging web elements. The Inspect Element feature in Firefox is particularly well-known for its unique layout and accessibility.
Ways to Inspect Elements in Firefox:
- Open Firefox: Launch Firefox on your Mac.
- Right-click on an Element:
- Right-click on any element on the page.
- Choose Inspect from the context menu. The Inspector panel will open with the selected element highlighted.
- Using Keyboard Shortcuts:
- Open Firefox Developer Tools with Cmd + Option + I.
- To inspect a specific element, hover over it and press Cmd + Shift + C to enter inspection mode.

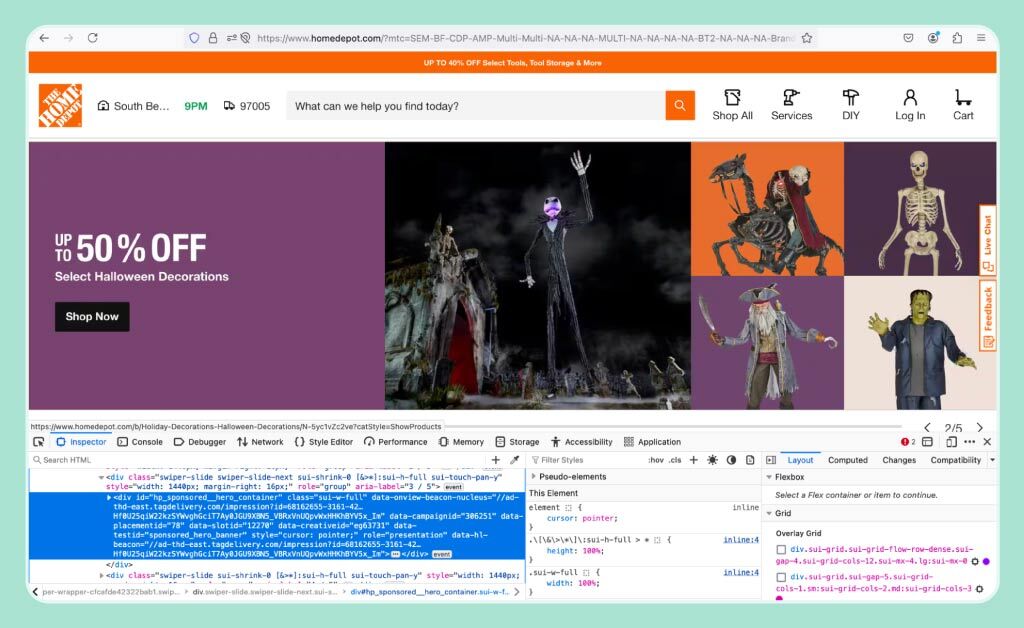
Navigating Firefox’s Developer Tools:
- Inspector Panel: Shows the page’s HTML and CSS. You can modify elements directly, and Firefox will reflect the changes instantly.
- CSS Grid Tools: Firefox offers a powerful CSS Grid Inspector, which is great for visualizing grid layouts.
- Fonts Tab: Shows details about the fonts used on the page, allowing you to modify or explore font settings.
- Console: Log information, execute JavaScript, and troubleshoot errors.
- Network Tab: Monitor network performance and check resources being loaded.
Unique Features of Firefox Developer Tools:
- Firefox Accessibility Tool: Check for accessibility issues and see how your webpage performs for users with disabilities.
- Grid and Flexbox Inspectors: Firefox offers detailed visual tools for analyzing grid and flexbox layouts, making it easier to debug complex CSS designs.
Best Practices to Inspect Elements on Mac
Inspecting elements is a key part of web development and design, enabling you to debug, test, and improve your website in real time. To get the most out of the developer tools, it’s important to adopt best practices that help you work efficiently, minimize errors, and stay organized. Here are some best practices to follow when inspecting elements on your Mac.
Keep Changes Organized and Documented
When using the inspection tool, it’s important to remember that all changes made within the browser’s developer tools are temporary. To avoid confusion, keep track of your edits. If you’re experimenting with CSS styles or adjusting the HTML structure, make sure to document any changes that work well so you can implement them in the actual code later.
Browsers like Chrome offer a “Changes” panel that allows you to track every adjustment made during a session. However, it’s best to copy any changes that you intend to keep into a file or your source code as soon as you finalize them. This ensures you don’t lose important edits and maintain consistency across your development environment. Keeping modifications organized also avoids unnecessary overwriting of styles, which can complicate debugging.
Leverage the Console for Debugging JavaScript
The Console is a powerful tool for debugging JavaScript and understanding what’s happening behind the scenes of a webpage. Start by checking for any JavaScript errors or warnings in the Console, as this is often the first indicator of problems within the script.
You can also test snippets of JavaScript directly in the Console to see how they affect the page. For example, if you want to test how a new function works, you can input the code and observe the result immediately without reloading the page. Another useful feature is console.log(), which lets you output variable values, making it easier to debug and track the flow of your code.
Test Responsive Design
Responsive design is critical in ensuring that your website functions well across different devices, from mobile phones to desktop computers. All major browsers provide built-in tools to simulate various screen sizes and devices.
In Chrome, for instance, you can toggle the Device Toolbar to switch between different device views, helping you understand how your webpage adapts to various screen sizes. Use this tool to inspect elements and make real-time adjustments to your CSS for mobile and tablet layouts. You should also check media queries and how different breakpoints impact the design.
Another important factor in testing responsiveness is network performance. Simulate slower network conditions using browser throttling features to understand how your website performs on mobile networks or low-bandwidth situations. This helps ensure your site is optimized for performance as well as layout across devices.
Master the Elements Panel for HTML and CSS Debugging
The Elements panel is a core feature in developer tools for inspecting and modifying the HTML and CSS of a webpage. To get the most out of it, use it to inspect specific elements by right-clicking on a page item and choosing Inspect. This action will highlight the corresponding HTML in the Elements panel, giving you a clear view of the code and CSS associated with it.
For CSS changes, the panel allows you to modify styles directly and see the effects in real time. This makes it easier to tweak designs without needing to recompile your stylesheets. When experimenting with different layouts or styles, you can disable or override existing CSS rules to see how they impact the design, helping to identify and fix issues faster.
Final Thoughts
Inspecting elements on a Mac is a crucial skill for web developers, designers, and testers. Whether you’re using Chrome, Safari, or Firefox, the ability to manipulate HTML and CSS in real time allows you to debug, optimize, and enhance your web pages efficiently. For those looking for a more robust solution across different browsers and devices, tools like BrowserStack or Sauce Labs can be a game-changer.
Incorporating these techniques into your workflow will help you work smarter and faster, and tools like QA Touch can help streamline your testing and development process.
Ready to elevate your web development game? Start your 14-day free trial today for all your web testing needs.


